Your expert in information design

Information design in Munich

We turn data, research and complex products into high-quality infographics, interactive visualisations and visual storytelling. Professional information design is the key to your communication strategy and carries your information across language and knowledge barriers.

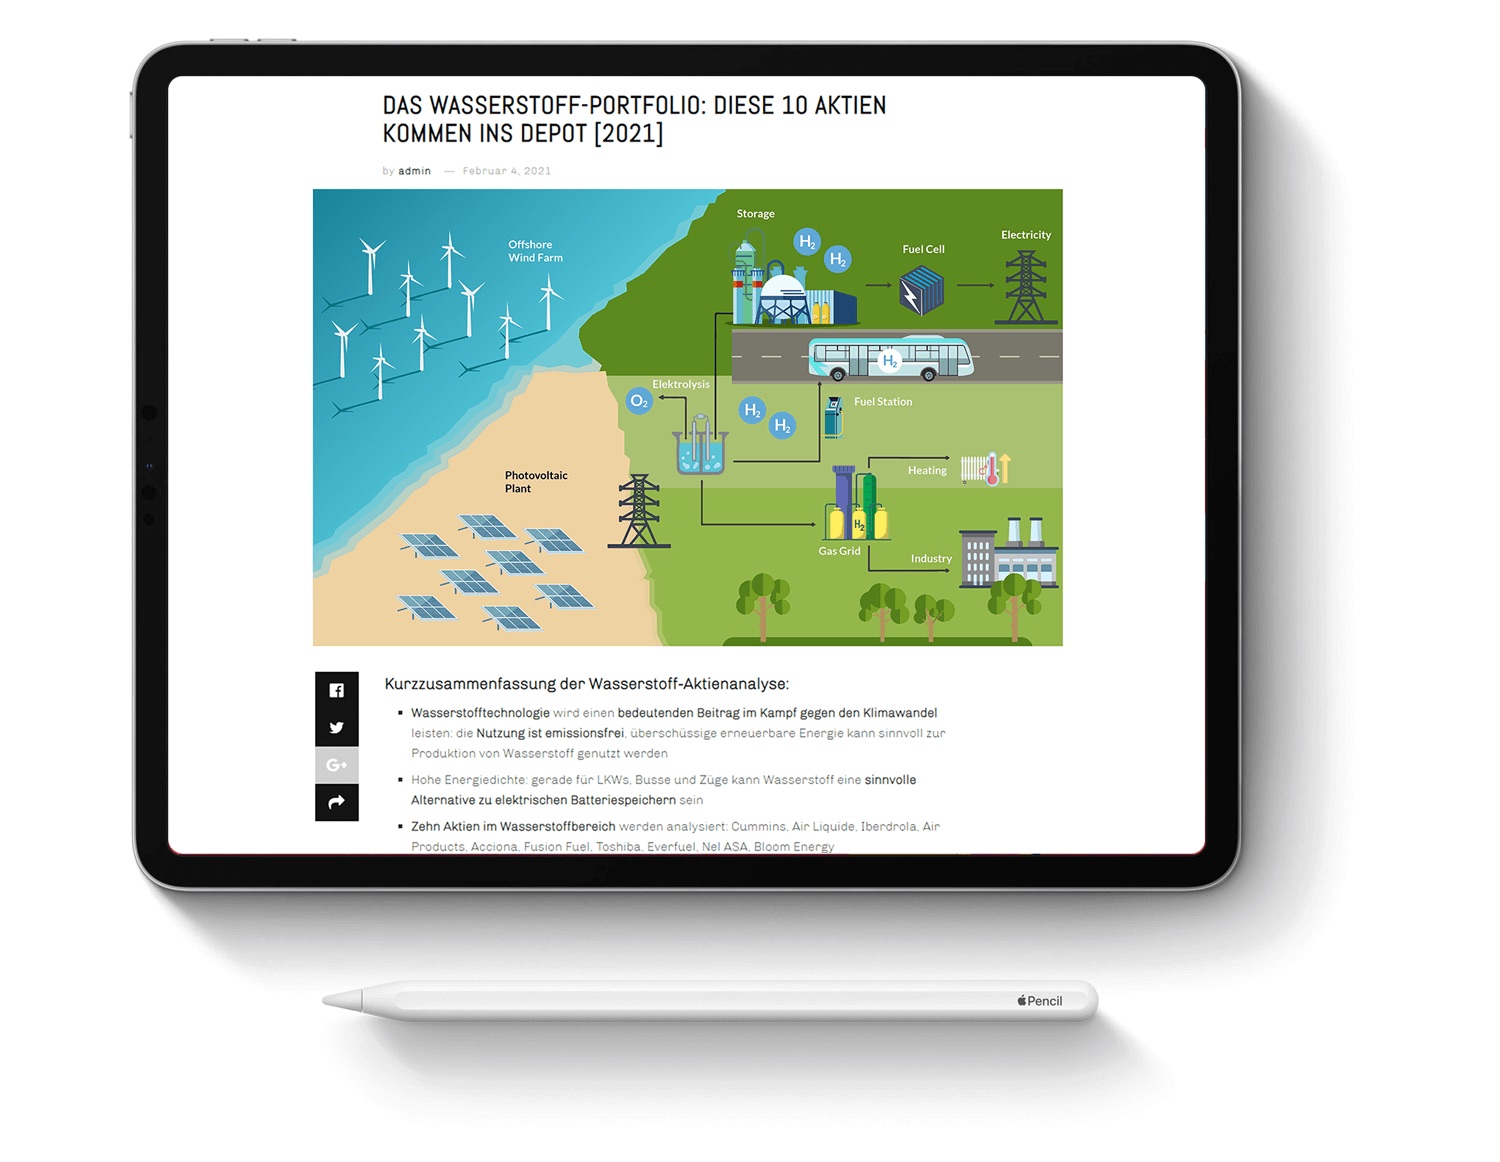
Tablet showing a feature article about hydrogen with an embedded full-page infographic of the hydrogen value chain
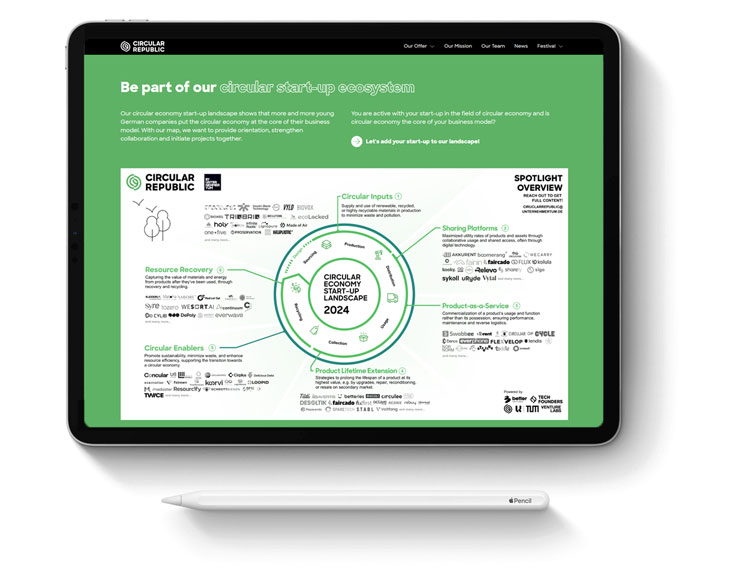
Tablet showing Circular Republic's Circular Economy Start-up Landscape 2024: a circular diagram that assigns companies to five fields of the circular economy
Circular Republic · Start-up Landscape 2024, an entire ecosystem on one page · circular-republic.org

Infographics for visualising research findings

In today's research landscape, where complex data and findings are everywhere, visualising research results plays a decisive role. Institutes and researchers face the challenge of making their extensive data and in-depth analyses understandable to a broad audience. Infographics are a powerful tool for presenting complicated matters in an informative and engaging way.

Creating tailored infographics that communicate your research findings clearly and concisely is one of our specialities. We turn your research data and results into visual storytelling that not only helps your audience understand, but also sparks curiosity and interest.

Information graphics designed in Munich

We help you create high-quality information graphics for your website, blog or news site. We turn your sketches, data and information into a custom information graphic. Our top priority is presenting the information in a way that is clear, effective and tailored to your audience. Give your visitors and readers visual added value with high-quality infographics that work across language barriers.

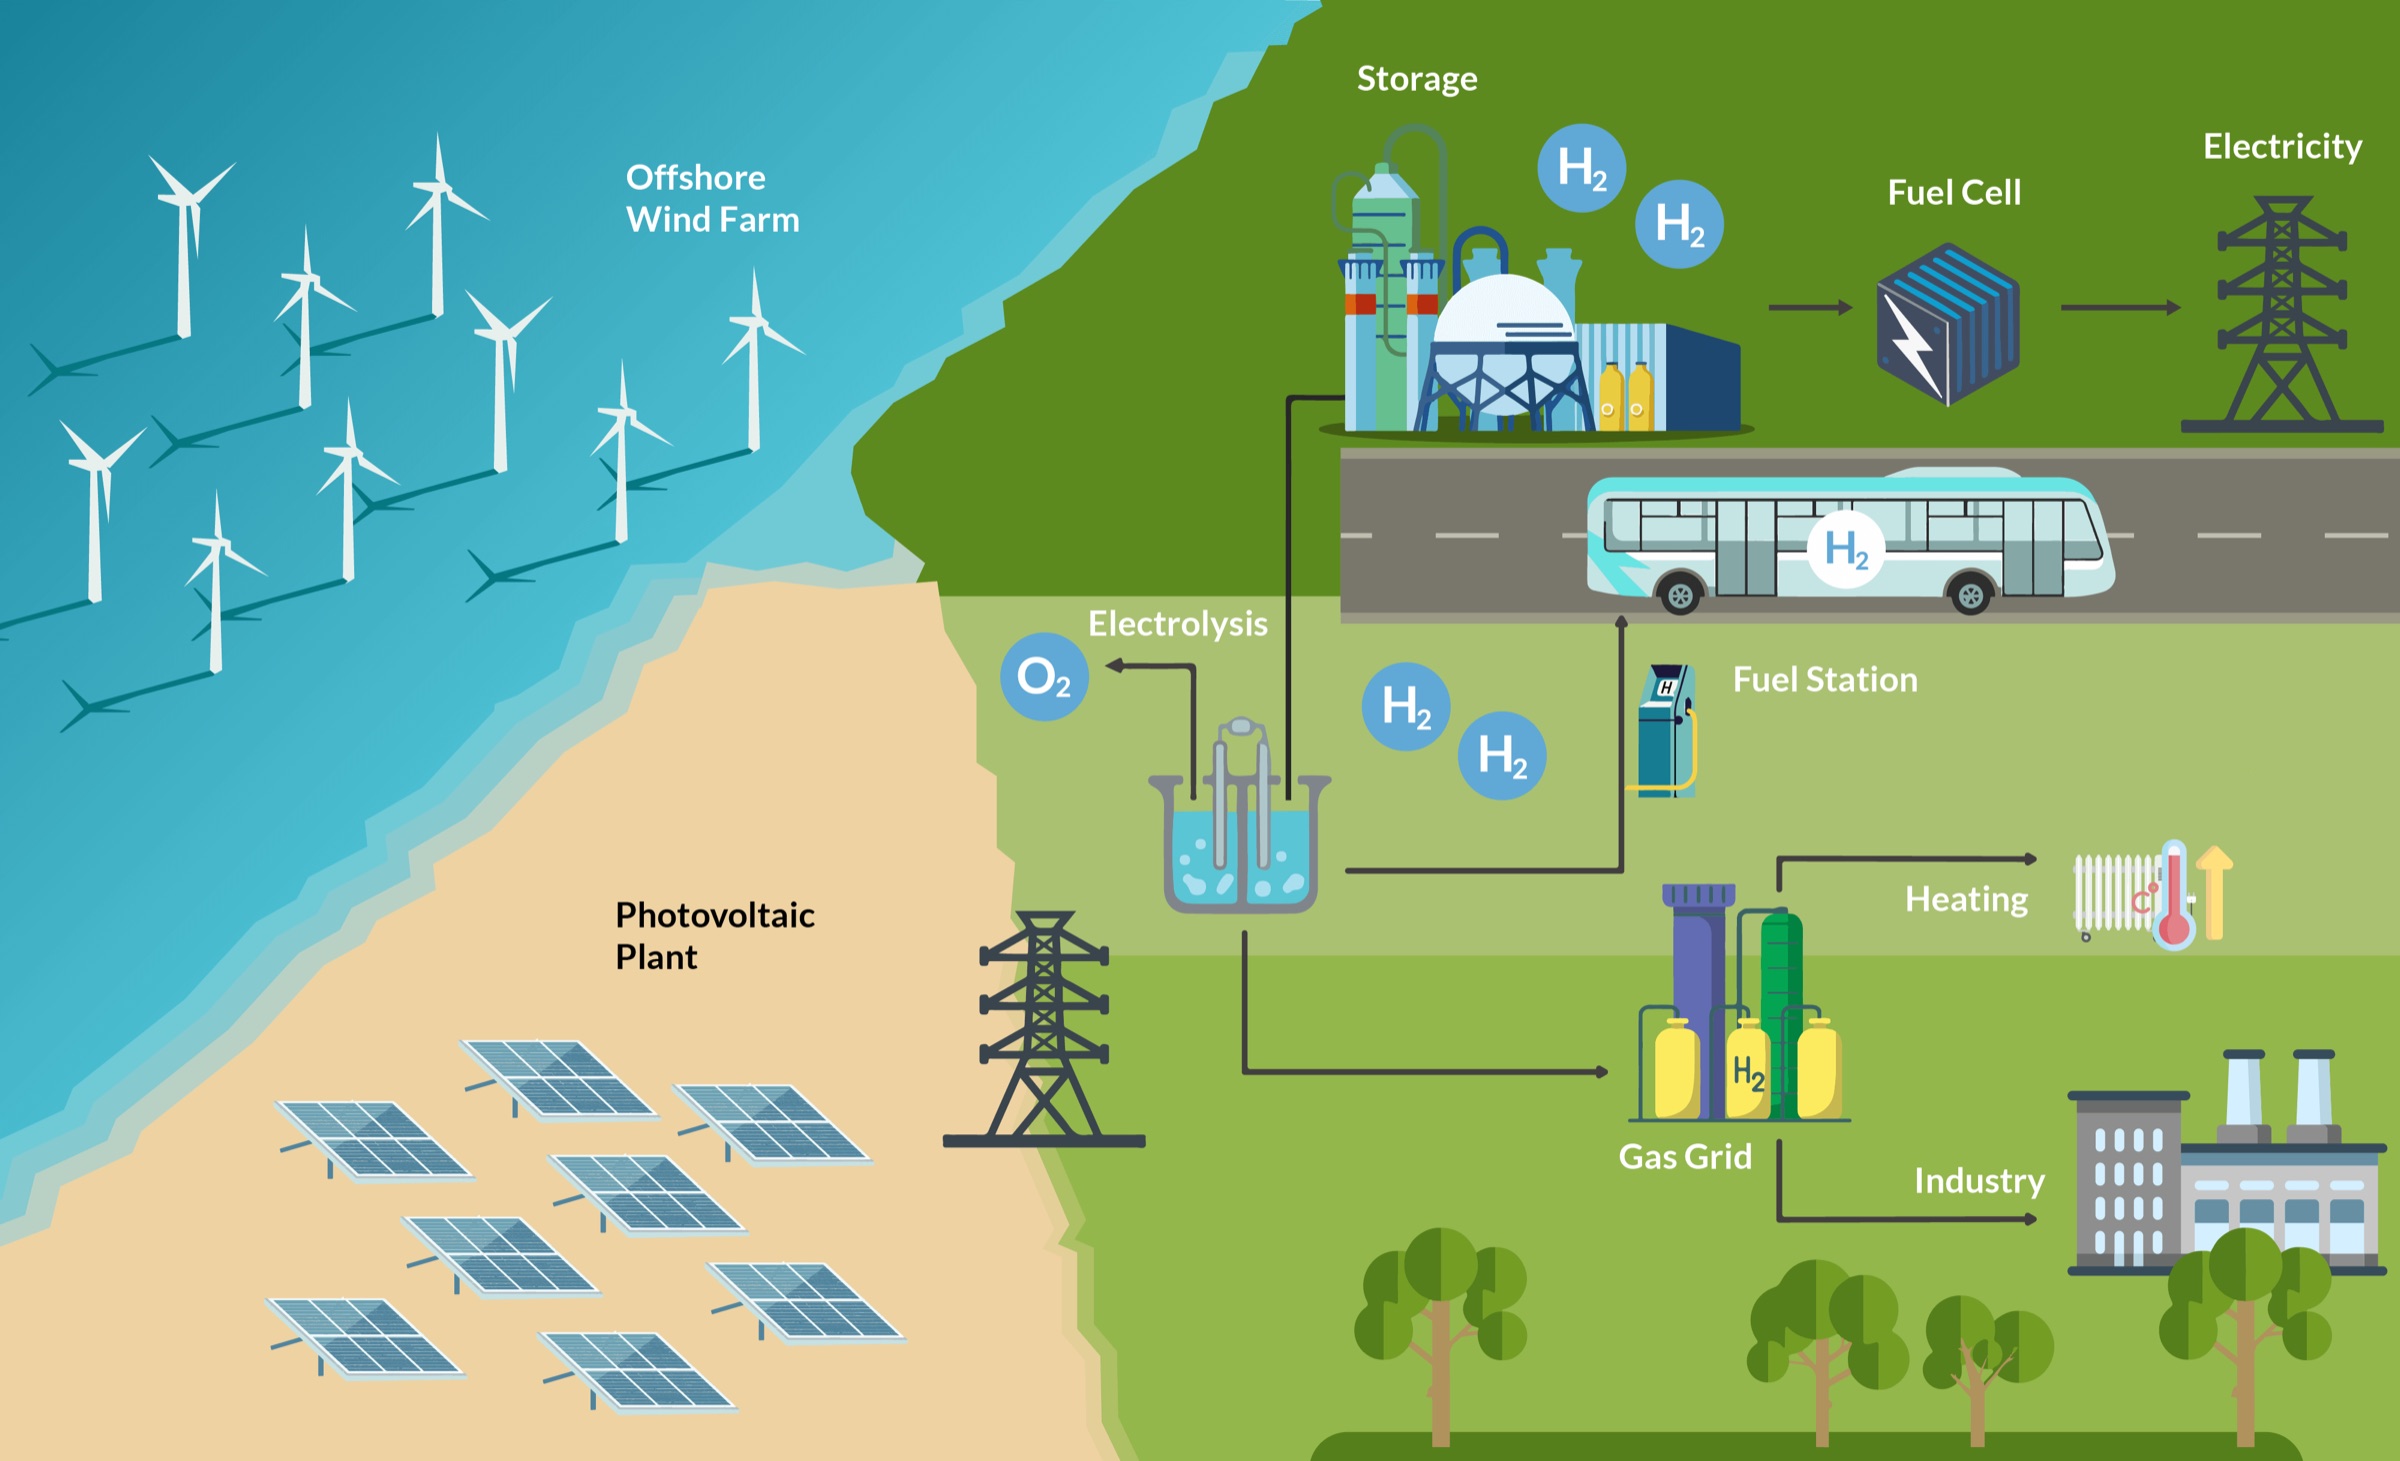
Infographic of the hydrogen value chain: offshore and onshore wind power and photovoltaics feed an electrolyser, and from there paths lead via storage, fuel cell and filling station to transport, industry and the power grid
Aktienschmaus · Hydrogen technology from production to application, built for a feature article · aktienschmaus.de

High-quality information graphics

High-quality information graphics make complex functional relationships clear to the viewer. When we create infographics, the focus is on presenting the relevant information. Text and infographic form a single, coherent unit and give the viewer real added value. Together with you, we develop concepts for presenting your information and company data efficiently and effectively.

What makes good information design
Professional information design

Good information design is precisely tailored to the audience it needs to reach. From concept and presentation to structure, an interdisciplinary approach matters a great deal in effective information design. We create clear infographics and illustrations that can be used for web and print, and within entire design manuals. This makes information visually easy to follow and understand.

Why infographics work

Exclusive vector illustrations

Complicated relationships, made transparent and unambiguous in a single image? Infographic elements such as diagrams, organisation charts and thematic maps create an overview and illustrate factual information such as process flows. We create custom vector illustrations that present your ideas and concepts simply and clearly. Give your visitors added value with well-structured information graphics.

Animated and interactive
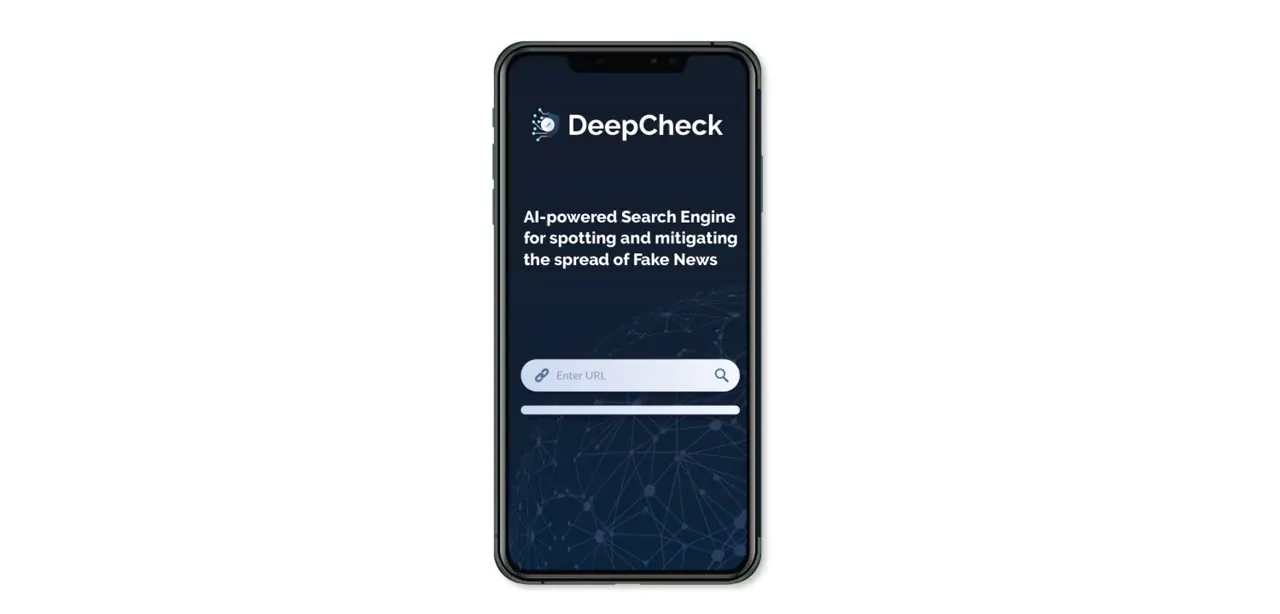
DeepCheck · Animation showing the four steps of a source check

Why should you use infographics?

For most people, constantly switching between devices and sources of information has become part of everyday life. A lot of information has to be processed in a short time to adjust to new situations. This often leads to information overload.

The task, then, is to present information so that the viewer can process it effectively and efficiently. Detailed descriptions of technical procedures or processes become easier to perceive and understand visually. Professionally designed information graphics make relationships unambiguous and easier to grasp. We create a custom infographic that presents your information clearly and unambiguously.

Professional information design: what makes it work?

First, you need to understand why high-quality infographics work so well. Whether in print, on social media or on websites, infographics are used everywhere to respond to changing media habits. Today, information and news are consumed on the go: on public transport, on the way to work or in short breaks. With infographics, you can get information across within a few seconds.

Professionally designed information graphics present difficult subjects effectively and efficiently. They also reduce topics to the essentials, so the most important information and relationships stick with the viewer. Not least, TV news programmes use simple infographics to explain complicated matters and back them up with figures and statistics. Viewers rate these as particularly positive and helpful.

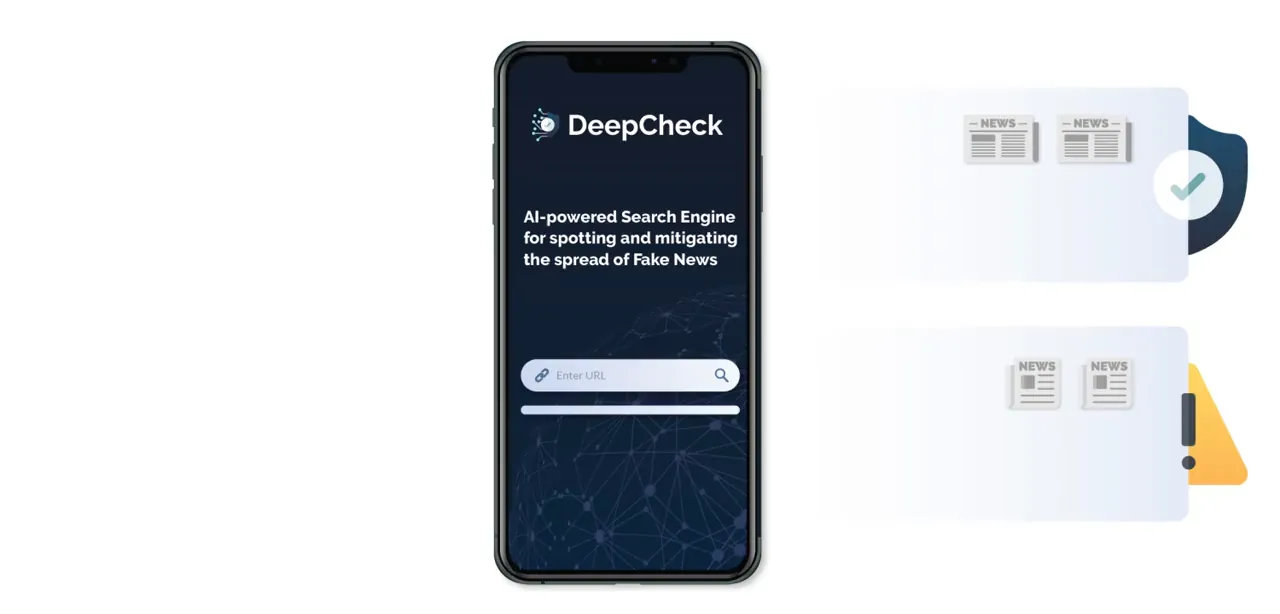
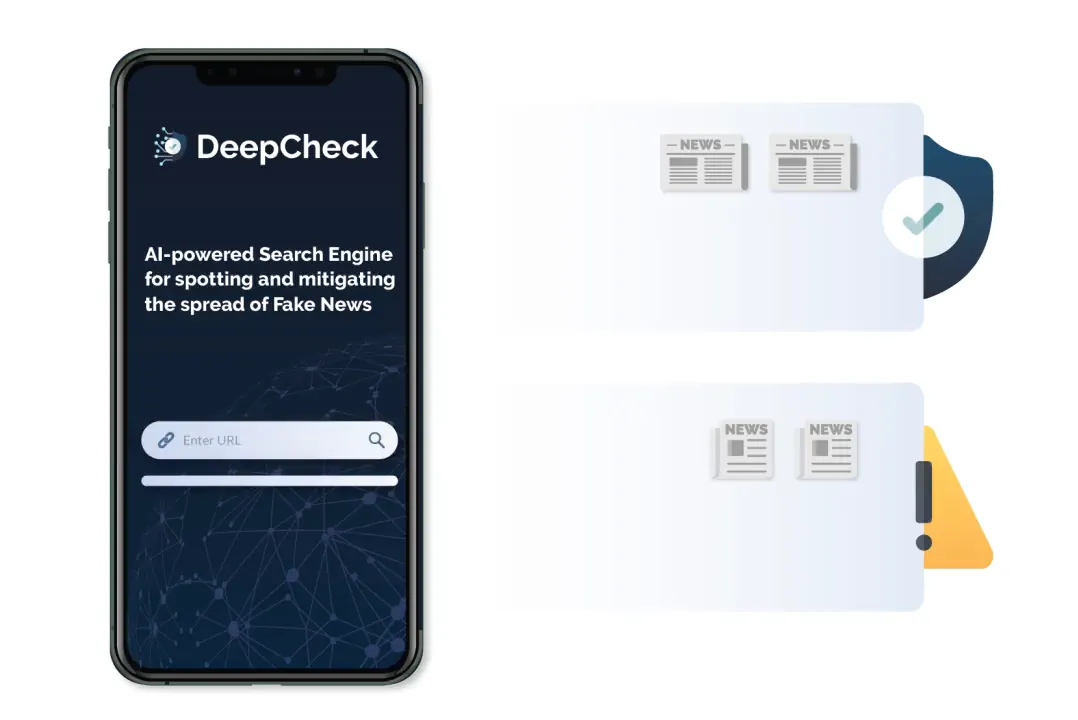
Monitor showing a DeepCheck explainer page on false reports, next to it a smartphone and an illustration that separates verified from unverified reports
DeepCheck · Information design for an application that detects false reports
DeepCheck · Animation showing how an article moves from the browser into the check
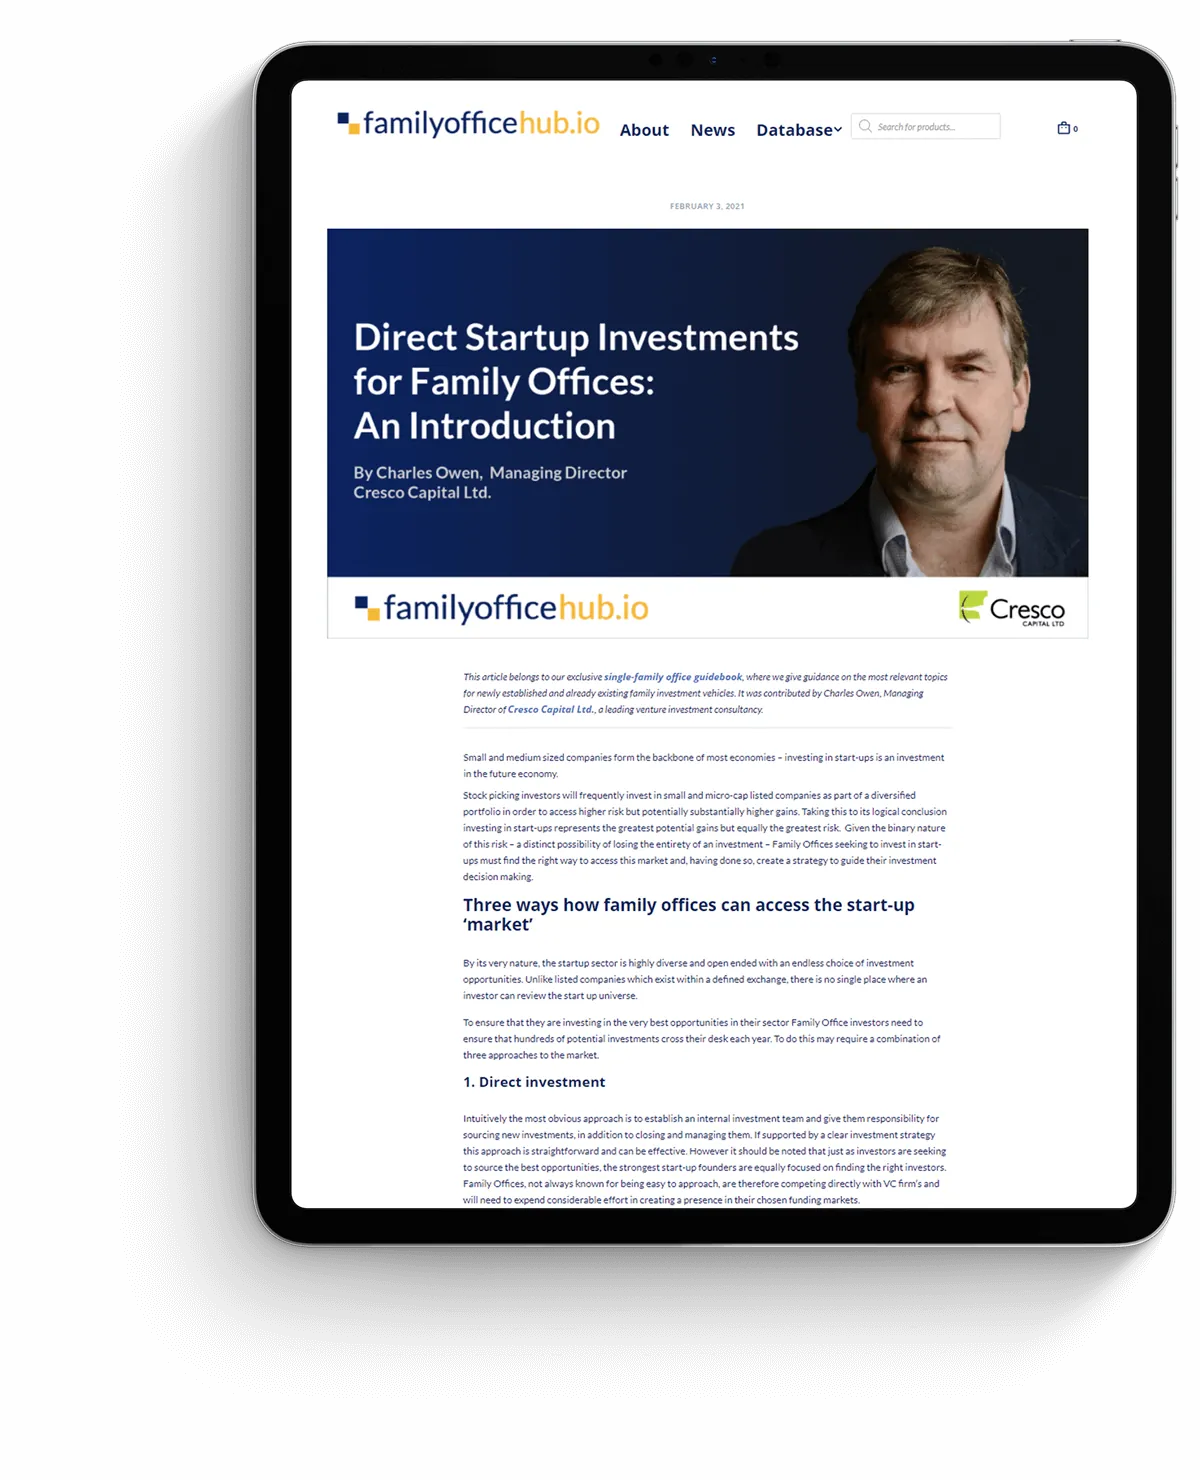
Upright tablet showing a Family Office Hub feature article on direct investments in start-ups, with a cover image and structured text
Family Office Hub · Layout and imagery for a feature article · familyofficehub.io

High-quality infographics and information design in Munich

Infographics are so effective above all because they offer real added value as attention spans keep shrinking. On average, a smartphone is unlocked almost 90 times a day. Assuming around 8 hours of sleep, that means once every 11 minutes. As a result, people can hardly concentrate on a feature film without glancing at their phone now and then. The upshot: information is consumed even more carelessly.

To compensate for this behaviour, professional information design and high-quality infographics combine simplicity with the efficiency of self-explanatory images or animated illustrations. We design your infographic around the needs of your target audience.

Interactive and animated infographics

Not every piece of information, process or sequence can be summed up clearly in a single image. Some relationships are so complex that they call for further explanation. In that case, interactive or animated infographics are an even more effective way to make information tangible and get it across. Moving images make information easy to remember, and most people prefer them to text.

Especially with a younger audience that mostly consumes images, videos and audiovisual formats, animated information graphics hit the mark. If interactive information design is so effective, why isn't all information prepared and delivered this way? The reason is obvious: it takes considerably more time to produce and is mainly suited to complex content and relationships.

DeepCheck · Animation that sorts a stream of reports into verified and questionable

Professional infographics get shared

Good, clear infographics are often widely shared, passed on or linked from other sites. With a credit on the infographic itself, in the source code or in the caption, the source, meaning your own website, stays visible. This in turn leads to more traffic. That makes good infographics attractive for your website or news site, your blog or your social media channels.

A simple illustration is also shared far more often than a detailed description. Once created, the infographic can be published for your audience on every platform and channel. We create unique infographics that stand out from the crowd and make your content transparent and tangible.

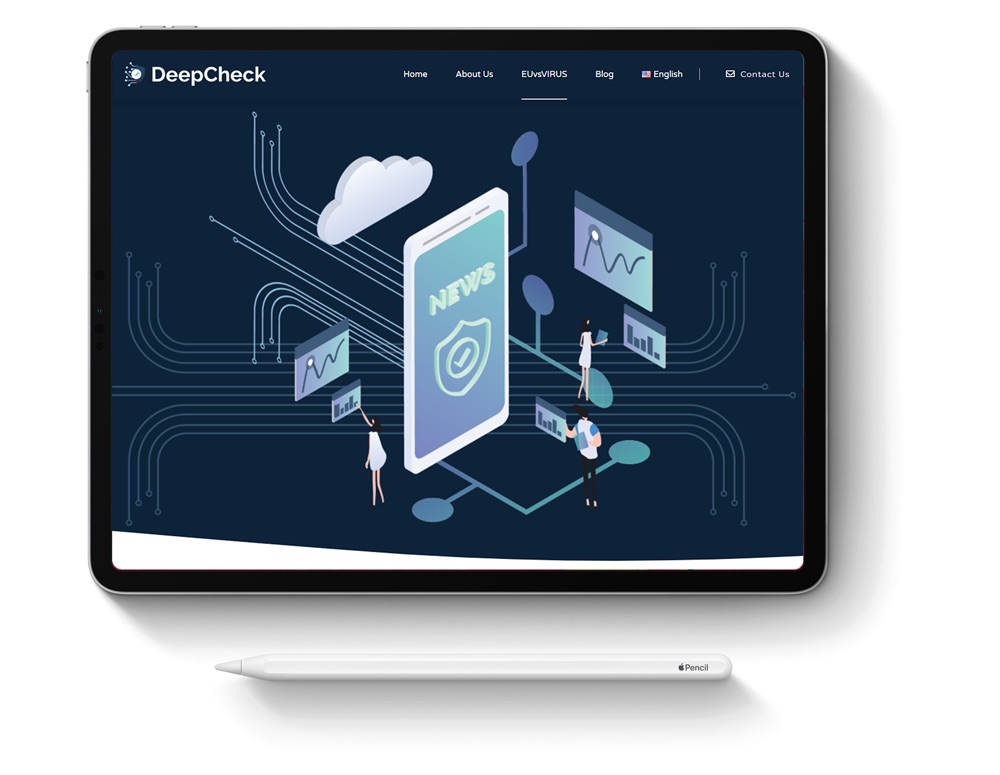
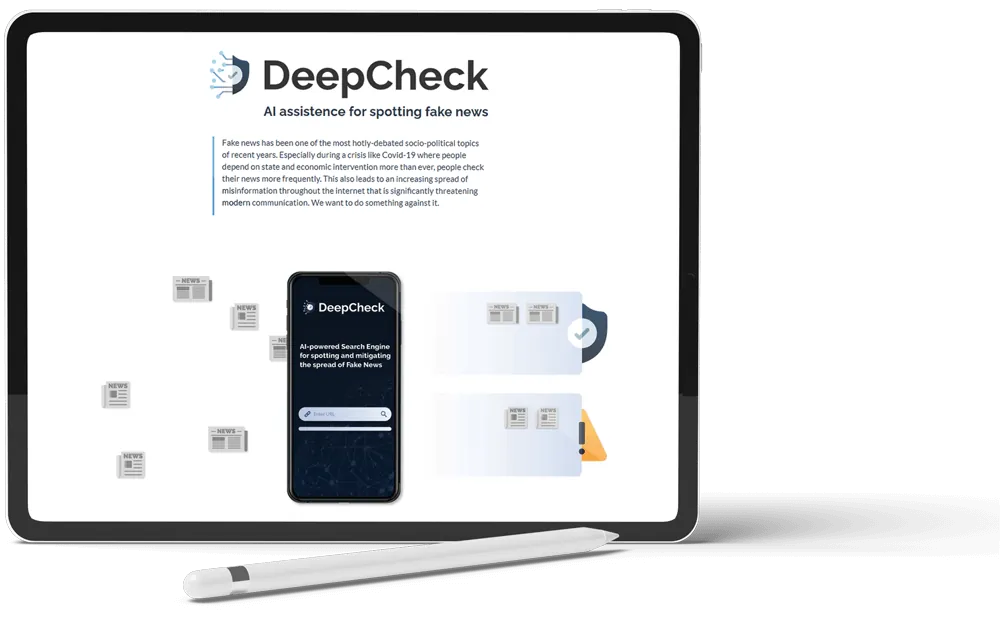
Tablet showing the DeepCheck home page with an illustration of a smartphone, a data cloud and charts
DeepCheck · Illustration for the home page, built from the same elements as the animations

Visualisations and information graphics make relationships clear

A good visualisation not only gives the viewer the feeling of having found a reliable source, it also makes it more likely that the infographic will be shared. Creating a good visualisation requires thorough research, a precise definition of the requirements and graphic professionalism.

Only then can the infographic stand out from the crowd and stay in the memory of readers and viewers. What's more, a single image can present figures and statistics visually and make them tangible. Users grasp what the numbers mean and also store the information with a visual component.

FAQ

Frequently asked questions about infographics

How much does an infographic cost?

Every graphic has a fixed price, which you receive in writing after the first briefing. It depends on how much data needs organising, how complex the presentation becomes and whether it is static or animated. You pay the fixed price, not for the time spent.

How long does it take?

Static and animated infographics are usually finished within a few days, because we speed up research and first drafts with AI. We set the delivery date in the quote and stick to it.

What do you need from me to get started?

Sketches, data, studies or simply a description of the relationship the graphic should show. The clearer the source, the fewer rounds of revisions the graphic needs. Anything missing, we clarify in the first conversation.

Do you also create animated or interactive infographics?

Yes. The three animations on this page were made for DeepCheck. Moving images pay off when a process has several steps that a single image can't keep apart. Production takes longer than for a static graphic, which is why it is mainly suited to complex content.

Who owns the usage rights to the finished graphic?

Once it is paid in full, you may use the graphic in all channels without any limit in time or territory. You also receive the open source files. We only show the work in our own portfolio if you agree.

Do you only work for clients in Munich?

Our focus is Munich, but we work from anywhere. An infographic doesn't require a meeting in person: sketches, data and revisions go back and forth digitally.

Don't see your question?

Book an intro call

Conclusion: the future belongs to information graphics and animations

Presenting information visually as infographics and animated graphics not only offers real added value; in the long run, people also prefer to click on it rather than on text-based content. In this form, information spreads best and gains traction. Add infographics to your content to increase your reach, your reputation and how original users perceive you to be.

The basic requirement for an effective infographic is professional execution and preparation of the information and data provided. If the infographic isn't understood at first glance, it won't deliver the hoped-for success.

Rentschler.digital is your expert in professional infographics and animations, based on thorough research and reliable sources.